
About
Hi, I’m Jinrui Wang (王金睿).
I’m a third year PhD student supervised by Dr. Uta Hinrichs and Dr. Benjamin Bach at Visual+Interactive Lab, The University of Edinburgh. Before that, I completed my MSc in Design Informatics (with distinction) at the University of Edinburgh (2022) and BEcon at University of International Business and Economics in Beijing (2020). My PhD research focuses on visualization atlases as an emerging form of visualization for communicating complex datasets to wide range of audiences. I'm passionate about research through practical designs in interactive data exploration.
My ongoing projects👩🏻💻:
Designing a visualization atlas on the social co-benefits of climate mitigation datasets with Edinburgh Climate Change Insitute.
Visualizing peace transistion data with PeaceRep, Edinburgh Law School.
News
Oct 25 :: I am visiting Bivwac for two month🇫🇷.
Oct 25 :: I am one of the student volunteers for IEEE VIS 2025. See you all in Vienna!
Sept 25 :: Is the third year starting already?! Time flies🏃♀️!
Aug 25 :: Our paper on Visualization Badges is accepted by IEEE VIS 2025 with Honorable Mention 🎉!
Aug 25 :: Wow we have two VIS posters! Check these out 👉 The Co-Benefits Atlas and Visualizing Peace Transitions
Publications
Loading publications...
Design Projects
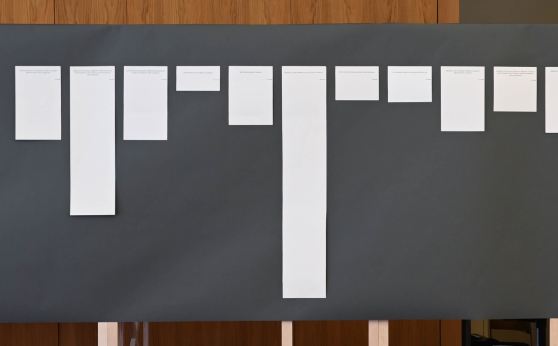
Pieces of Peace: Women and Gender in Peace Agreements
Jun 2024 - VIS Art Program
Physicalization of women and gender issues mentioned in the Afghanistan post 2000s intervention process using debossing technique.
[view online]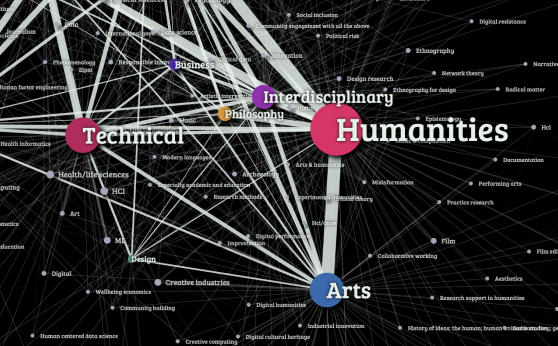
Responsible AI Community Network
Aug 2023, with Braid
Large screen network display for visualizing interdisciplinary community at the launch of BRAID: Bridging Responsible AI Divides programme.
[view online]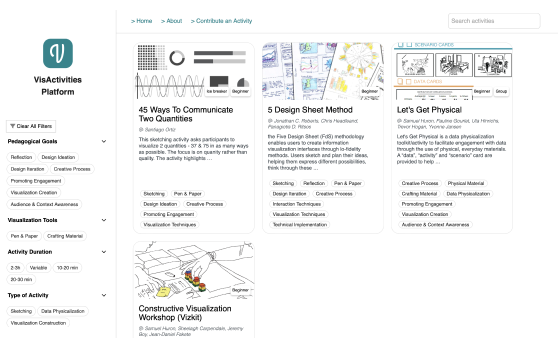
VisActivity Platform
Apr 2022 - Jun 2023, with DDI small grant
Designed and developed the front-end for a platform collecting data physicalization activities.
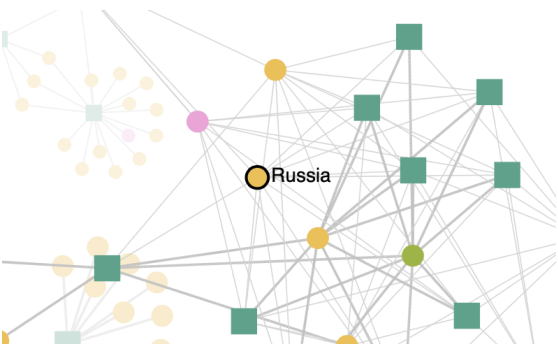
Russia as a Global Peace Actor
Nov 2022 - Mar 2023, with PeaceRep
Actor network dashboard visualizing Russia's involvement in peace and transition processes, in collaboration with PeaceRep project.
[view online]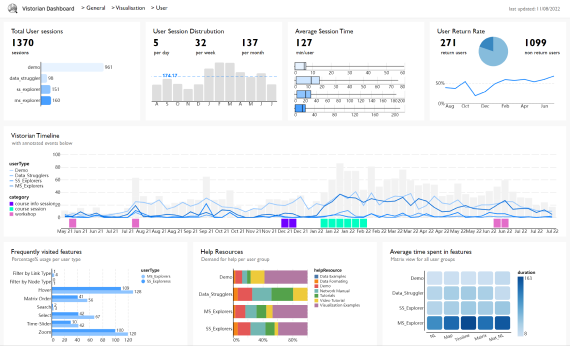
Vistorian Dashboard
Apr - Aug 2023, MSc Project
A three-page interactive dashboard display depicting overall user activity, visualization diagram comparison and individual session timeline.
[view online]